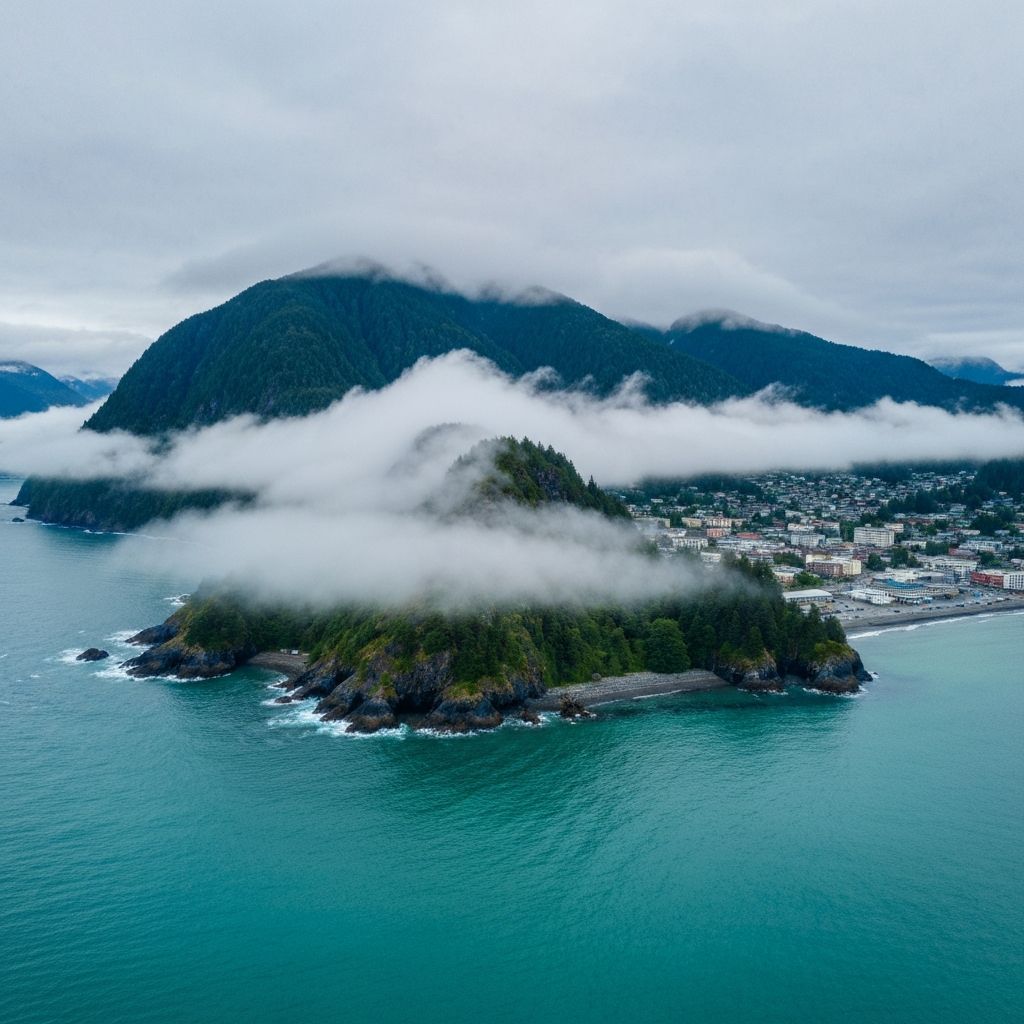
Ketchikan, Alaska
Whales & Lunch
A high-capacity, premium whale experience designed for the cruise era.
$4.63M
Year 1 Revenue
54%
Gross Margin
$1.16M
Net Income
The Journey
Sample 4-Hour Tour Itinerary
0:00 – 0:30
Boarding
Boarding, safety briefing, cultural welcome
0:30 – 2:00
Whale Watching
Prime whale-viewing in Revillagigedo Channel / Behm Canal with live naturalist commentary
2:00 – 3:00
Lunch Service
Catered lunch and optional alcohol service (heated cabin & open decks)
3:00 – 4:00
Return
Scenic return with additional wildlife opportunities
Market Context
Ketchikan Tourism
annual cruise passengers
trips/season
2 trips/day × 156 days
pax capacity
at 45% utilization
Market Funnel
Monthly Cruise Volume & Operating Days
Distribution Partners
Cruise Lines
Typical Commission Range
40–50%
for cruise-booked excursions
Booking Channel Mix
20% direct website bookings
Competitive Landscape
Market Position
Unit Economics
Ticket Economics
Adult Ticket
$230
80% of guests
Child Ticket
$160
20% of guests
Cruise Channel
80% of bookingsDirect Channel
20% of bookingsWeighted Net Revenue (per passenger)
Direct Booking Advantage
more net revenue per passenger vs cruise channel
Ancillary Revenue
Photo Sales
Single Photo
$25
3-Photo Bundle
$35
Full Gallery
$55
$115K
Conservative
15% conversion
$191K
Realistic
25% conversion
$306K
Optimistic
40% conversion
Per Trip
$682
Per Month (peak)
$38K
Per Season
$191K
Brand Extension
Merchandise
T-Shirt
$30
Cost
$7
Hoodie
$55
Cost
$15
Hat/Beanie
$15
Cost
$4.5
Gross Revenue
$60K
1820 items sold
Gross Profit
$44K
~74% average margin
Financial Model
Year 1 Revenue
Revenue Breakdown (Year 1)
Total Revenue
Gross Profit
Net Income
Gross Margin
Cost Structure
Financial Outlook
Two-Year Performance
Based on 3% year-over-year growth assumption
2026
2027
Passengers/Season
0
Capacity Utilization
0%
Trips/Season
0
Year 1 Highlights
- • $1.2M free cash flow from season one
- • 45% capacity utilization (conservative)
- • 80/20 cruise vs direct booking mix
- • ~20,639 total passengers
Margin Expansion Drivers
- • Shift toward direct bookings (no 50% commission)
- • Photo sales opportunity (~$155K potential)
- • Alcohol attachment rate optimization
- • Shoulder season demand capture
Due Diligence
Risk & Mitigation
Weather & Sea
Ketchikan averages 150" rain annually
Mitigation
All-weather heated cabin, flexible rebooking, rain ponchos provided
Cruise Schedules
Tight port timetables and delays
Mitigation
Efficient 4-hour loop, dock-adjacent location, schedule coordination
Whale Variability
Wildlife is unpredictable
Mitigation
Expert naturalists, radio network for sightings, enriched educational content
Fuel Costs
Diesel price volatility
Mitigation
Fuel-efficient design, bulk purchase agreements, optional surcharge buffer
Staffing
Remote location challenges
Mitigation
7-on/7-off rotation, housing assistance, local training partnerships
Investment Thesis
Exit & Upside
Cash Flow Multiple Range
based on industry comps for profitable tour operators
Cash Flow Returns
Steady dividends from operations with potential for accelerated debt paydown
Strategic Acquisition
Attractive target for larger tour operators or cruise line vertical integration
Expansion Optionality
Second vessel deployment or new port markets (Juneau, Sitka)
Exit Timeline Optionality
Year 2
Track record
Year 3
Exit optionality
Year 4
Prime window
Year 5
Expansion phase
Next Steps
Interested in Learning More?
We are seeking qualified investors for this opportunity. Request our full investor package including detailed financials, vessel specifications, and market analysis.
This presentation contains forward-looking statements and confidential information intended solely for accredited investors.